AI & Automation
Operations Console
Gain live insight into incidents
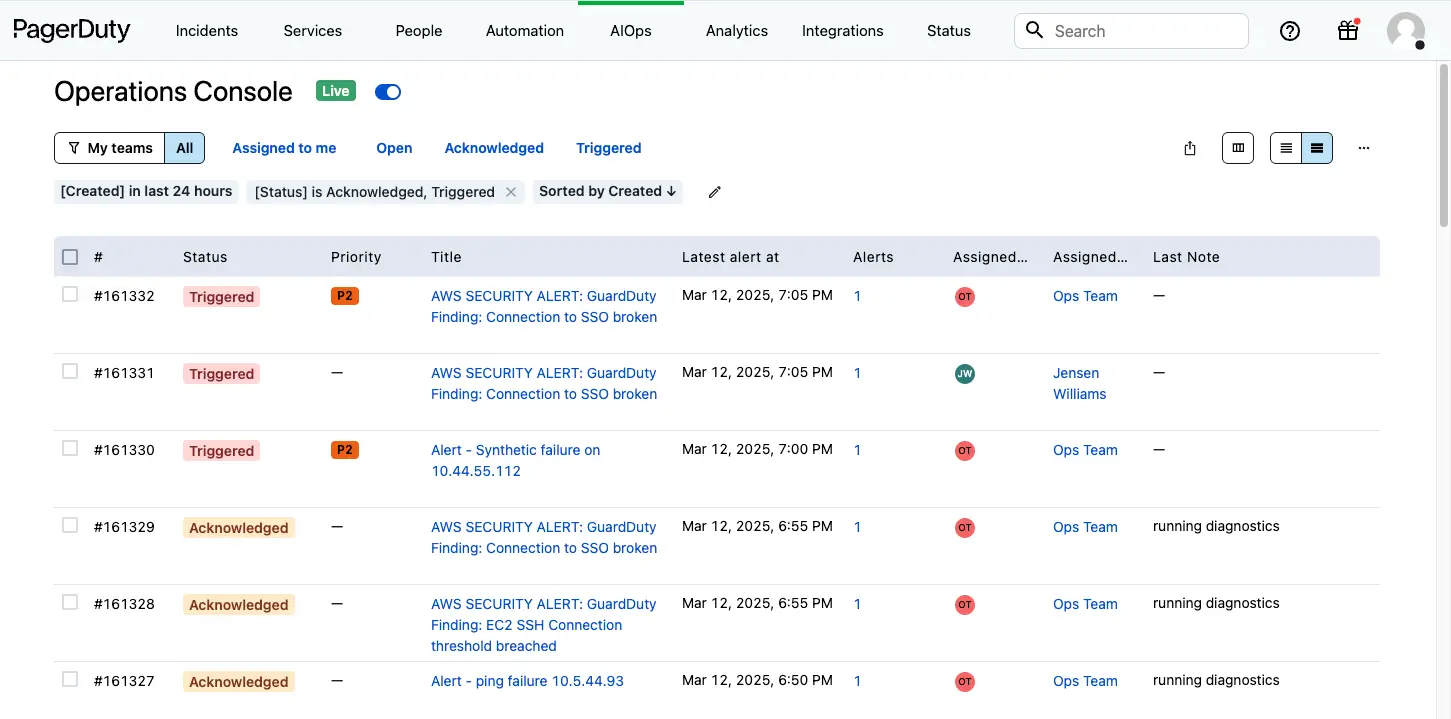
The PagerDuty Operations Console offers live visibility into incidents, and you can create customized views to triage and take immediate action on issues. This feature provides central IT teams and technical stakeholders with at-a-glance context on their technical environment in order to more efficiently triage incidents, and minimize MTTA and MTTR.
Availability
View the Operations Console
In the web app, navigate to AI Operations Console.
Japanese Language Support
The Operations Console supports Japanese as a display and interface language. Depending on your permission level, you can update this at the account or profile level:
- For Account Admins (Global Default):
Navigate to Account Settings and locate the Default Voice and Interface Language dropdown to set the default for the entire organization. - For Individual Users:
Navigate to My Profile, click the pencil icon next to Voice Language Setting, and select Japanese from the dropdown menu.
AIOps Service Incidents Only
AIOps Service Configuration Availability
Configure the Operations Console
The console offers users great flexibility to customize the live incidents table. This includes the ability to add or remove standard incident, alert, and custom-defined columns, as well as filter, sort, and apply other configurations.
Column Selector
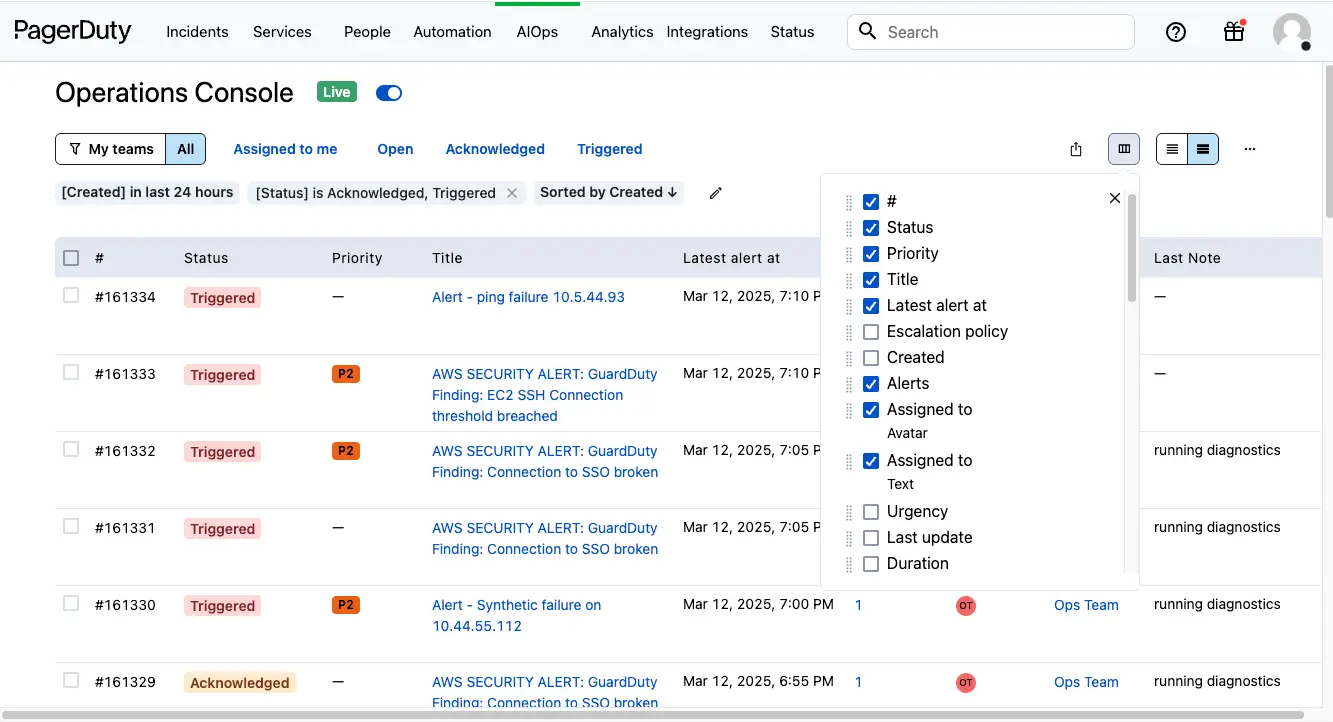
You can customize which fields are visible in the incidents table by adding, removing or reordering the fields. Click to open the column selector panel and select/deselect your desired columns. Reorder columns by dragging and dropping them to their preferred location.
You can also resize a column's width by clicking and dragging the edge to your desired size.
Users can also sort by up to three columns simultaneously.
 Column selector
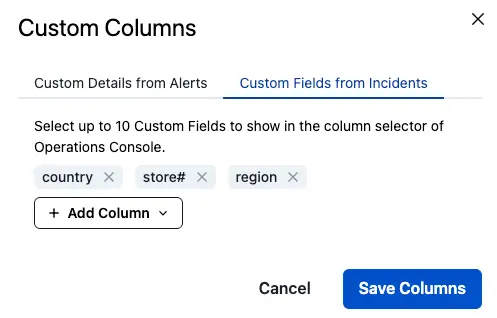
You can also display Custom Fields on Incidents in the live incidents table by clicking Custom Columns at the bottom of the Column Selector and adding them to the table. You can add up to ten Custom Fields in the Operations Console's incident table. If you wish to display a new field but are unable to, please deselect an existing custom field first. You can sort on up to three columns in the incidents table.
 Custom columns
Tip
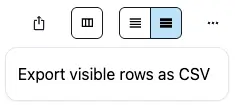
You can also export the all loaded incidents with your customized columns as a CSV file using the menu.
 Export visible rows as CSV
Side Panel
You can view incident details by clicking on an incident's Title or alert count in the Alerts column. The side panel provides contextual information pertaining to the incident, including snoozed time (if applicable), alert grouping details (if applicable), alerts fields, alert custom details and so on, so you can view all things at a glance in one place.
You can also change the width by dragging the side panel horizontally to view more or fewer alert columns. PagerDuty will remember your settings for later visits.
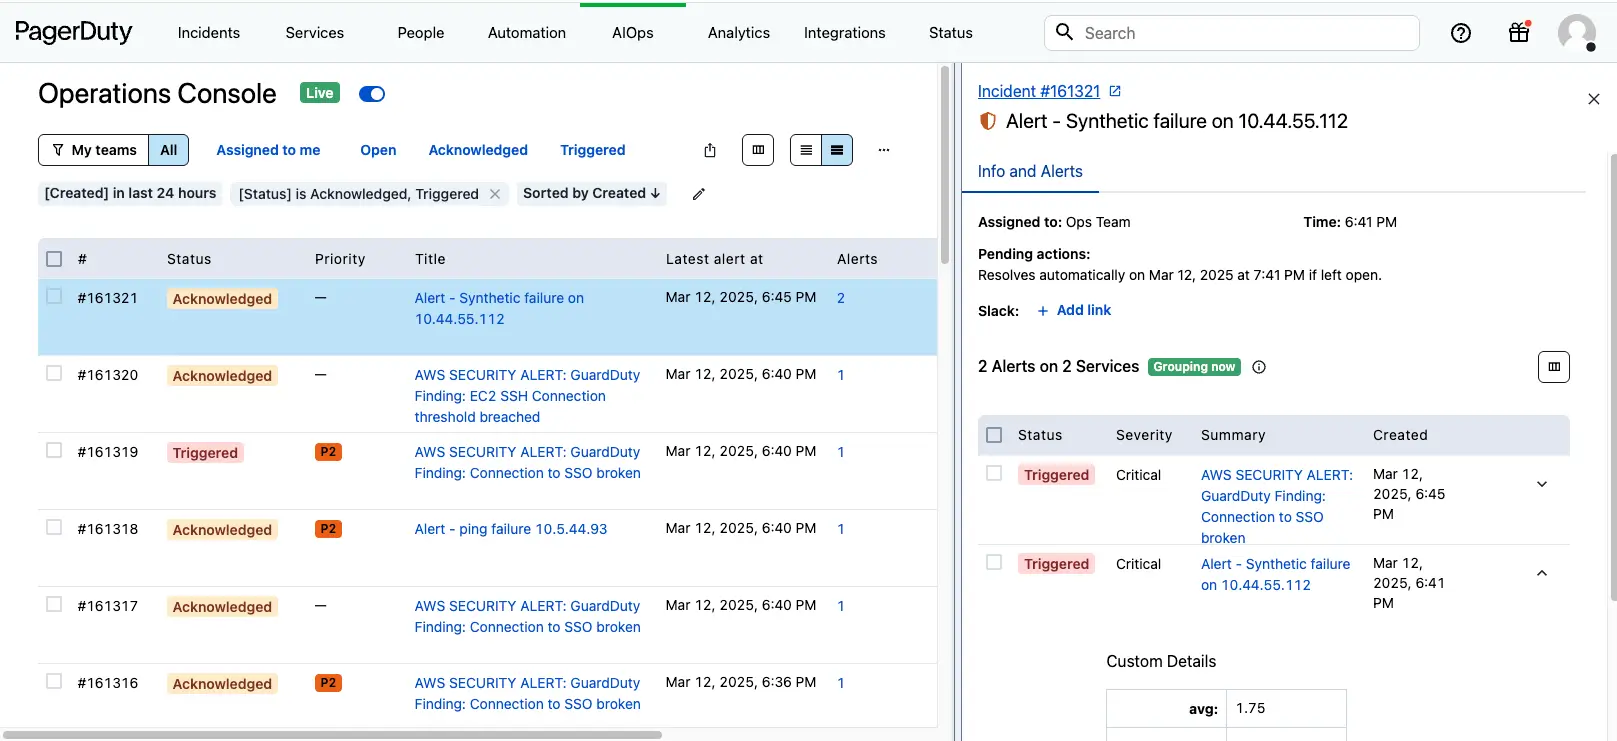 Operations Console side panel
Filters and Search
At the highest level, you can show:
- All incidents
- My teams to display just incidents belonging to your Teams.
You can also quickly filter by incident status:
- Assigned to me
- Open
- Acknowledged
- Triggered
AIOps Service Incidents Only
For more granular filters:
- Click to open the the filter panel.
- Click Add and select from the following:
- Alert Services
- Assignee
- Auto Resolved
- Duration
- Date
- Escalation Policy
- External Reference
- Incident Number
- Latest Note
- Main Service
- Priority
- Responder
- Status
- Teams
- Title
- Urgency
- User
- Custom Fields on Incidents
- Custom Details on Alerts (Available by request)
- Depending on the field(s) you select, enter the appropriate criteria and click Apply Filters.
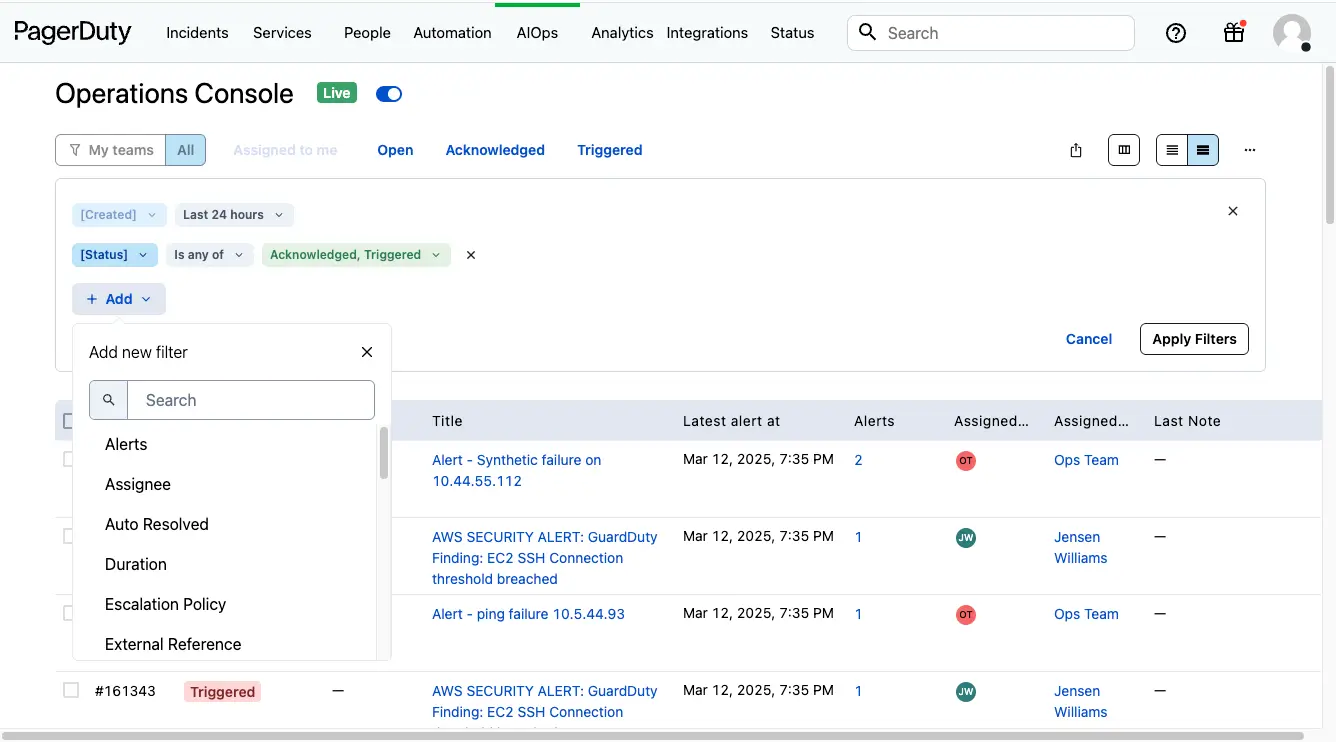 Filters and search
Additionally, users can perform keyword search to filter on incident Title, Incident number and Latest note.
Tip
You can perform keyword search with conditions such as contains, starts with, equals, does not contain, and combine AND/OR operators to filter across a number of fields such as Incident Title, Incident Number, Last Notes. You can define up to five keywords with AND/OR operators.
For optimal performance, enter at least three characters for searches with the contains filter.
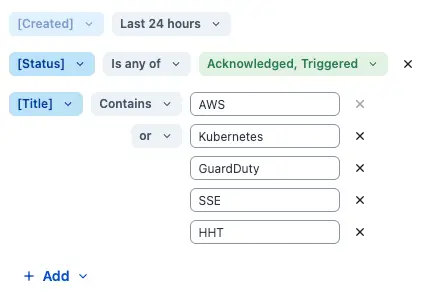 Keyword search
Actions
To take action on incidents within Operations Console, select the checkbox to the left of the incident(s) and click your desired action:
- Resolve
- Acknowledge
- Add Responder
- Reassign
- Run
- Merge
- Snooze
- Update Priority
- Add Note
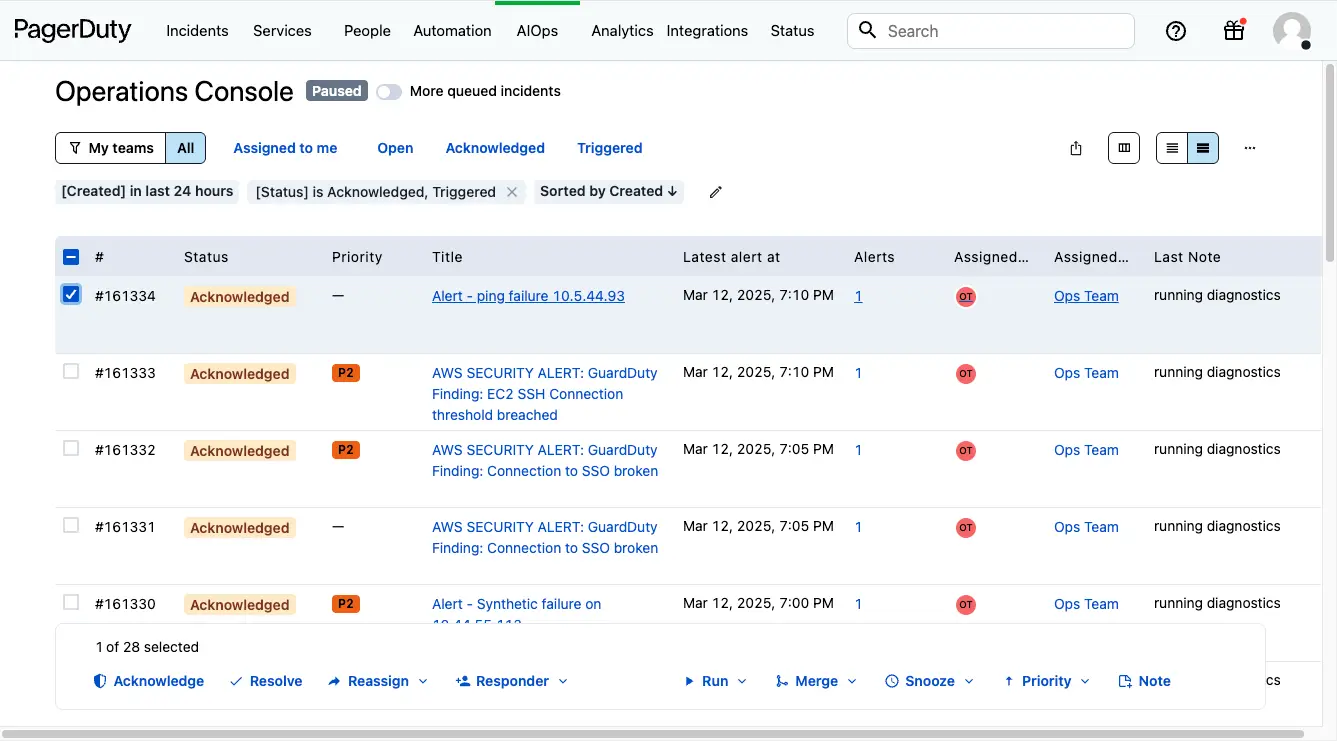 Incident actions
Bulk Actions
When you want to perform actions on multiple incidents at once, you can click the selection box at the top of the incident table. This will select the first 50 incidents on the current page, and list the bulk action options at the bottom of your screen. Select from the following actions:
- Acknowledge
- Resolve
- Add Responder
- Reassign
- Merge
- Snooze
- Update Priority
- Add Note
Incident Feed Update Frequency
To optimize performance or during incident storms, you can toggle between Live and Paused update modes. By default, the console is set to Live updates, which continuously adds new incidents, and corresponding updates, to the feed.

You can optionally pause live updates by clicking the toggle. While Paused, new incidents will not be added to the Operations Console, but updates to existing incidents will still be displayed. Users can manually update the incident table by refreshing the page.

Custom Details
Available By Request
You can define and add specific custom details fields from your alert payload to the incidents table.
- Click to open the column selector panel.
- Scroll to the bottom of the list and click Add Custom Detail.
- In the modal, enter a Table Header and the Custom Details Path (e.g., the name of the field as it appears in the alert payload, such as
sourceorapplication).- Optionally click + Add Column to add multiple custom detail columns at once.
- Click Add Columns.
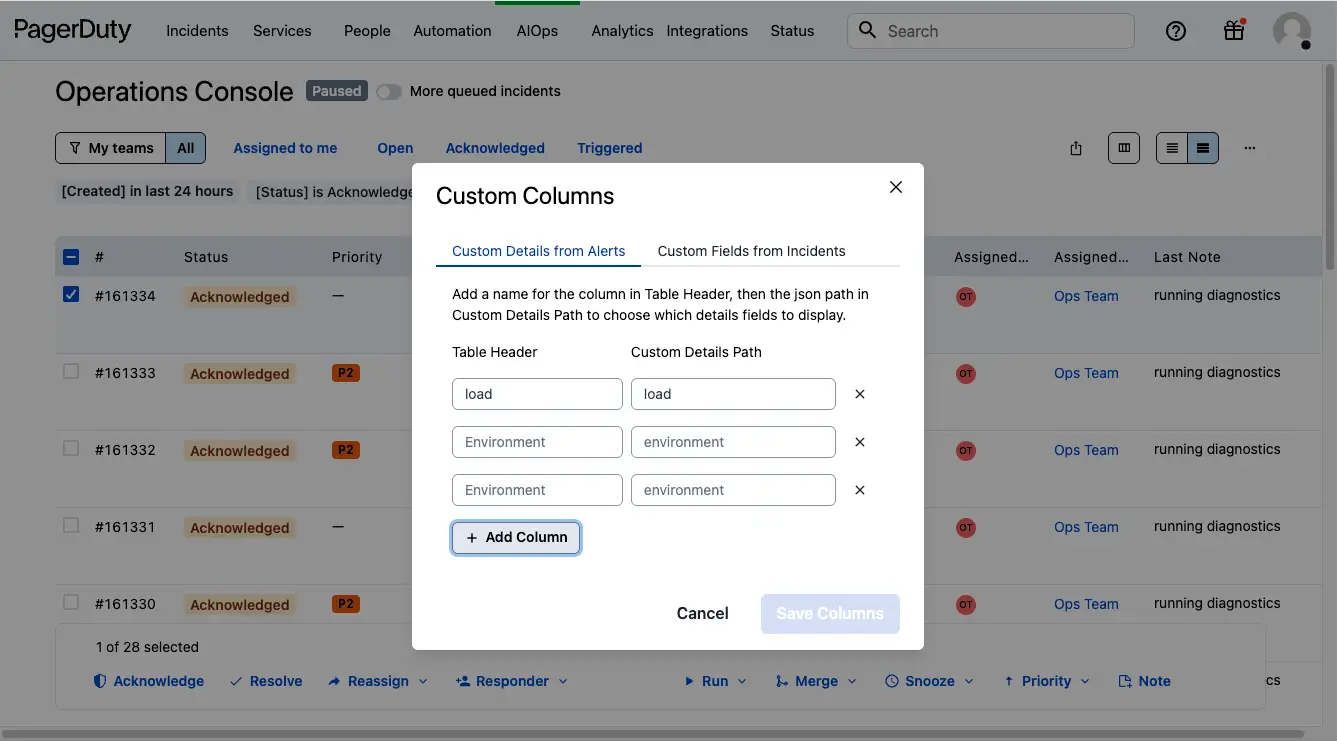 Custom columns
Service Health Visualization
Service Health Visualization aggregates active incidents by Service into an interactive graph in the Operations Console to quickly identify hotspots and emerging issues.
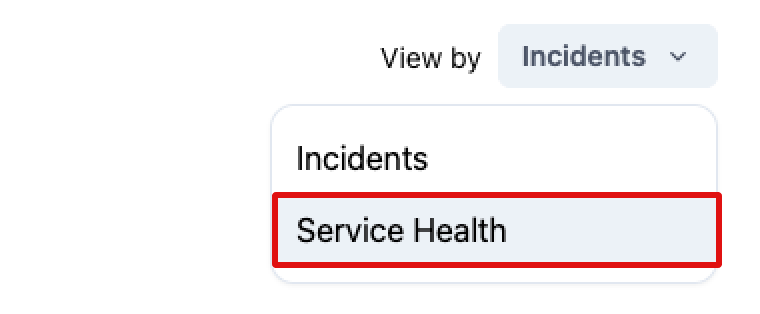
Access Service Health Visualization
- In the PagerDuty web app, click AIOps Operations Console.
- Click the View by dropdown.
- Select Service Health.
Use the Incidents-by-Service Graph
- Multi-select filters: Combine filters to refine results during active incidents.
- Click to drill in: Select a service and time to view incident count and links to incident details. If more than 20 incidents exist, a link to the full Open Incidents list is provided.
- Only services with active incidents will be accessible in the graph.
- Services are automatically sorted by the number of active incidents.
Apply Filters
- Click to open the filter panel.
- Click Add and select from the following:
- Created
- Team
- Service
- Priority
- Depending on the field(s) you select, enter the appropriate criteria and click Apply Filters.
Triage Example
- Spot the spike: Identify a sudden increase in incidents for a particular service on the graph.
- Focus on service(s): Apply a service filter to isolate that service and any related dependencies.
- Drill in: Click the service to view links to active incidents.
- Coordinate: Use your incident workflows to mobilize teams and update stakeholders.