Incident Management
Incident Activity Insights
The Incident Activity insights report offers a visualization of response effort over time. It also includes an Incidents List with metrics including TTA, responder count, TTE, response effort, TTR, and escalation count.
Warning
Deleted Services
Incidents that belong to a deleted service will not appear in the Incident Activity insights report.
View Incident Activity Insights
To view the Incident Activity insights report, navigate to Analytics Insights and select the Incident Activity tab.
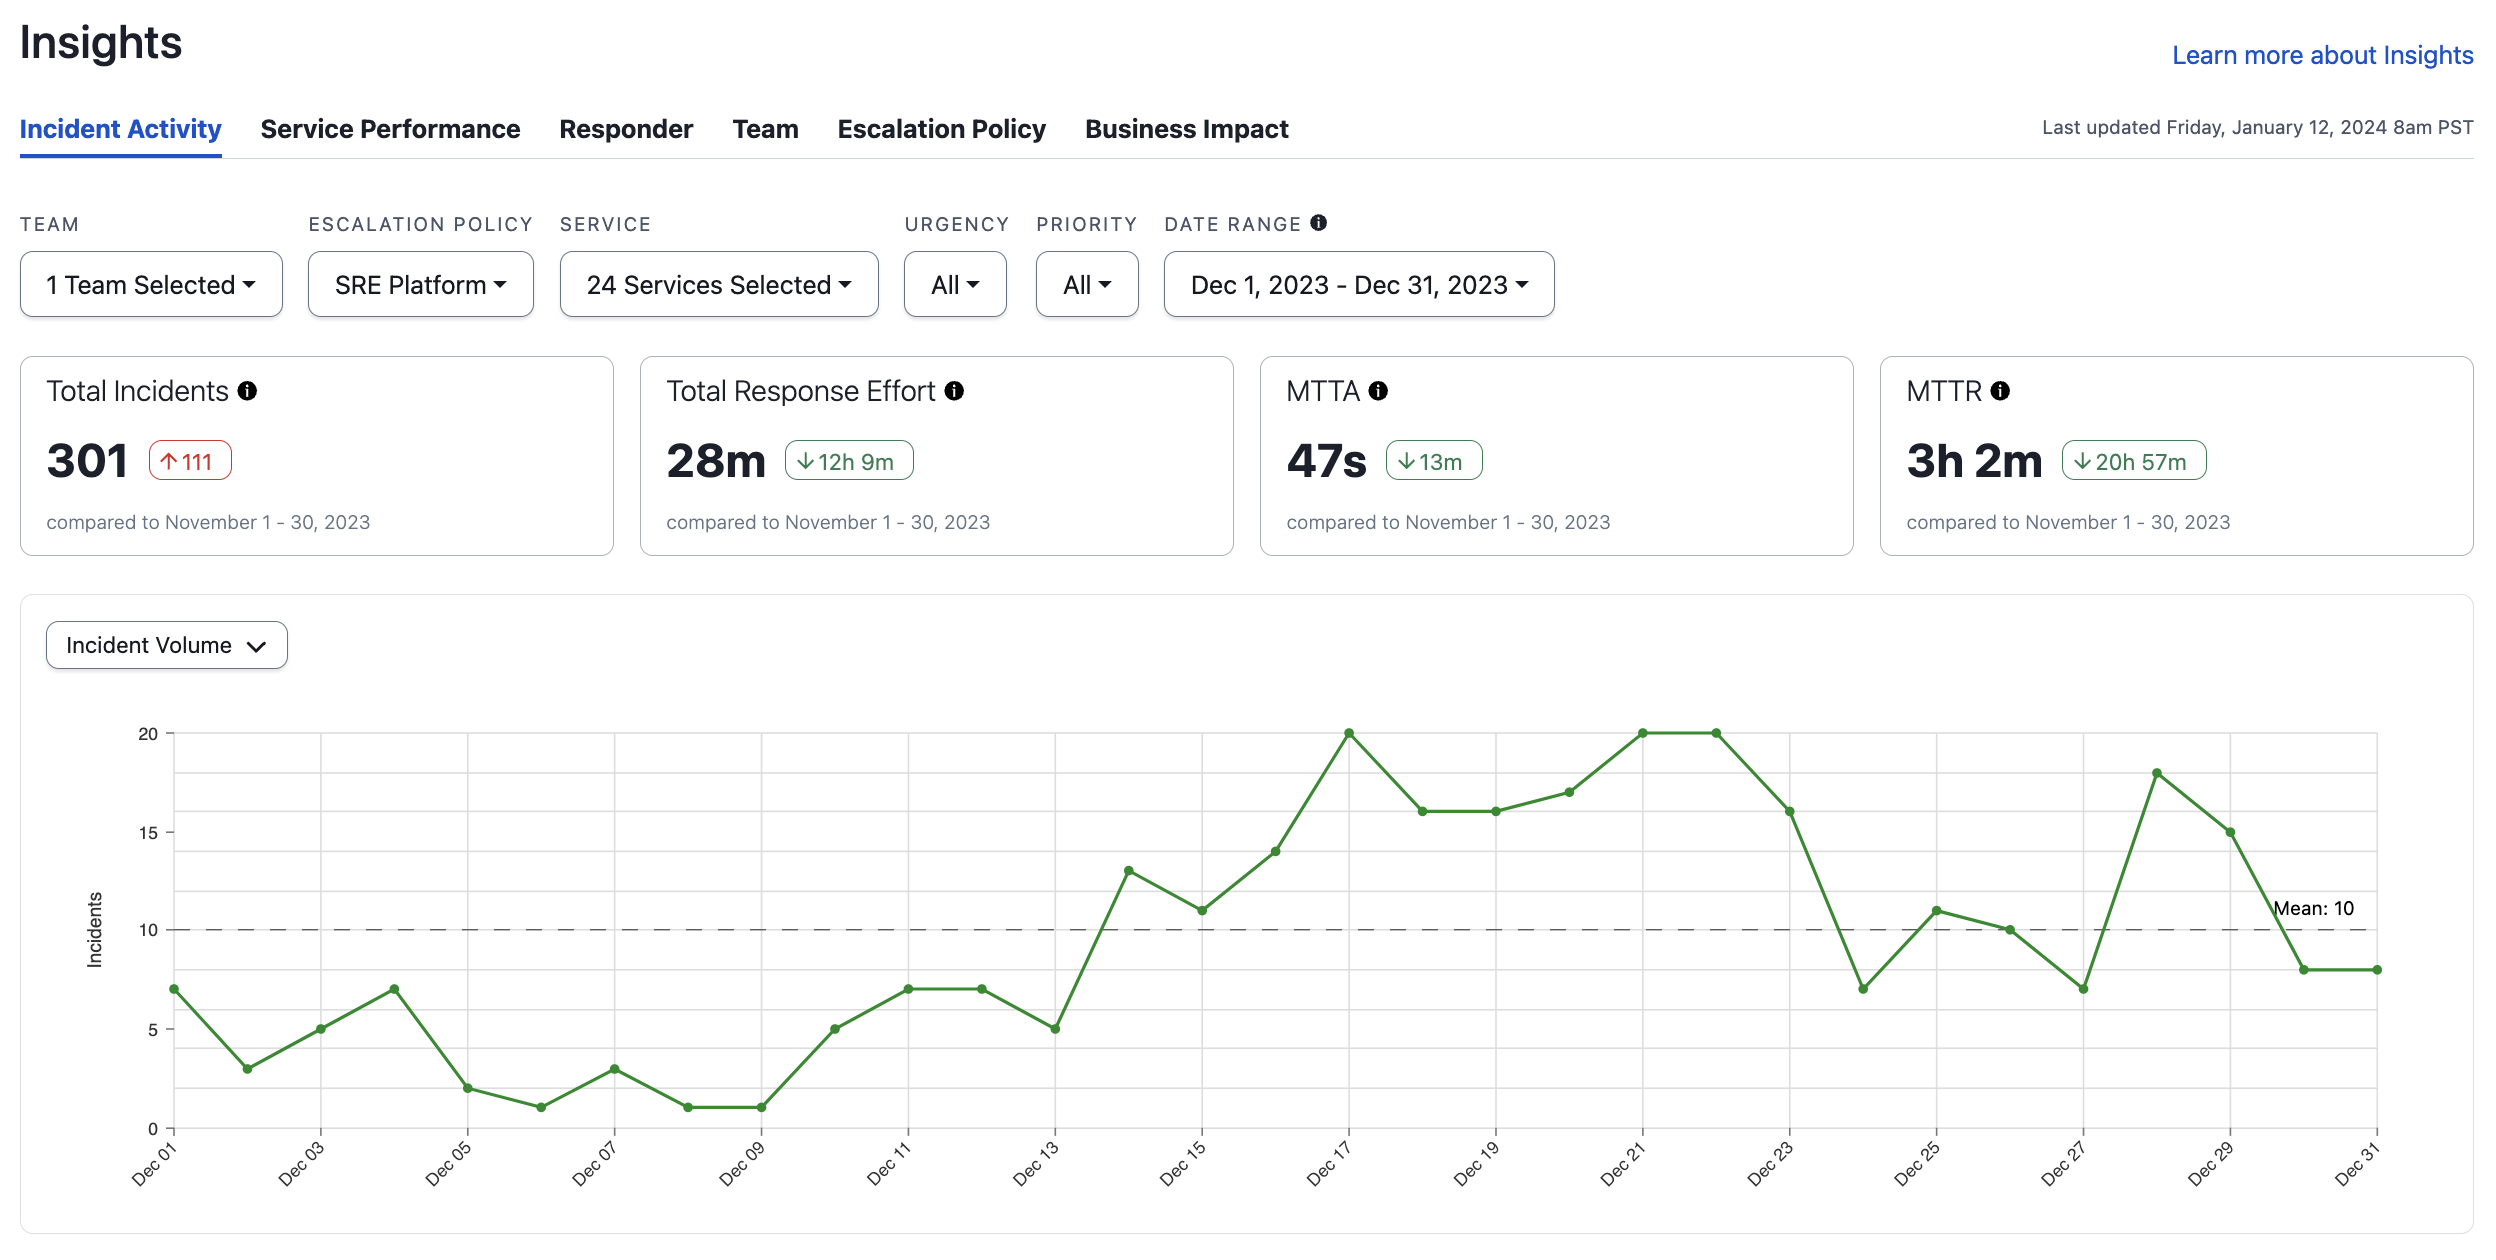
Filter Insights
You can apply filters to each insights report by clicking at the top of the page next to the date range dropdown. This will open an editor where you can add, edit and remove filters.
Team Filtering Behavior
Team filter results may vary between the Incidents list and Insights reportsbecause each view evaluates Team associations differently. The Incidents list tracks every Team an incident has been associated with throughout its entire lifecycle, whereas Insights and Analytics filter strictly by the Team currently associated with the incident’s service at the time the report is generated.
Consequently, if a service has been reassigned to a different Team after an incident has been triggered, that incident may appear under its original Team in the Incidents list but under the new Team in Insights. This is expected behavior and typically occurs following service reassignments or changes to an escalation policy’s Team association.
Add Filters
- Select a Date Range from the dropdown at the top of the page.
- Click the icon to the right of the date range dropdown.
- Click Add.
Filter Condition Type | Operators | Value Instructions |
|---|---|---|
Escalation Policies |
| Select escalation policy(ies) |
Incident ID |
| Enter an incident ID |
Priority |
| Select the priority level(s) |
Services |
| Select service(s) |
Status |
| Select the incident status(es) |
Teams |
| Select the My Teams tab to only see your Teams, or the Teams tab to see all Teams. Then select Team(s). See the note about Teams Filter Behavior above for more information. |
Urgency |
| Select the urgency level |
If you have configured Custom Fields: | Varies based on custom field type: | Varies based on custom field type: |
- Click Apply Filters in the bottom right of the editor.
To edit or remove a filter:
- Click under the date range dropdown at the top of the page.
- Edit the available filters, or click to the right of a filter to remove it.
- Click Apply Filters in the bottom right of the editor.
Summary Metric Cards
Each card includes a comparison time period. For example, if your selected time period is the last week, the cards show you the change in each metric compared to the week prior.
| Metric | Description |
|---|---|
| Total Incidents | Total count of incidents matching the active filters. |
| Total Response Effort | Total time responders spent engaged in resolving incidents. Measured from the time a responder acknowledges or accepts a responder request until the incident is resolved. The user-defined incident duration, if it exists, is used for this calculation. Read Edit Incident Duration for more information. |
| MTTA | MTTA is the average amount of time from when an incident is created until the time the first responder acknowledges an incident. Excludes incidents that were not acknowledged. |
| MTTR | MTTR is the average amount of time from when an incident was created until it was resolved. Excludes incidents that have not been resolved. |
Note
Percentiles
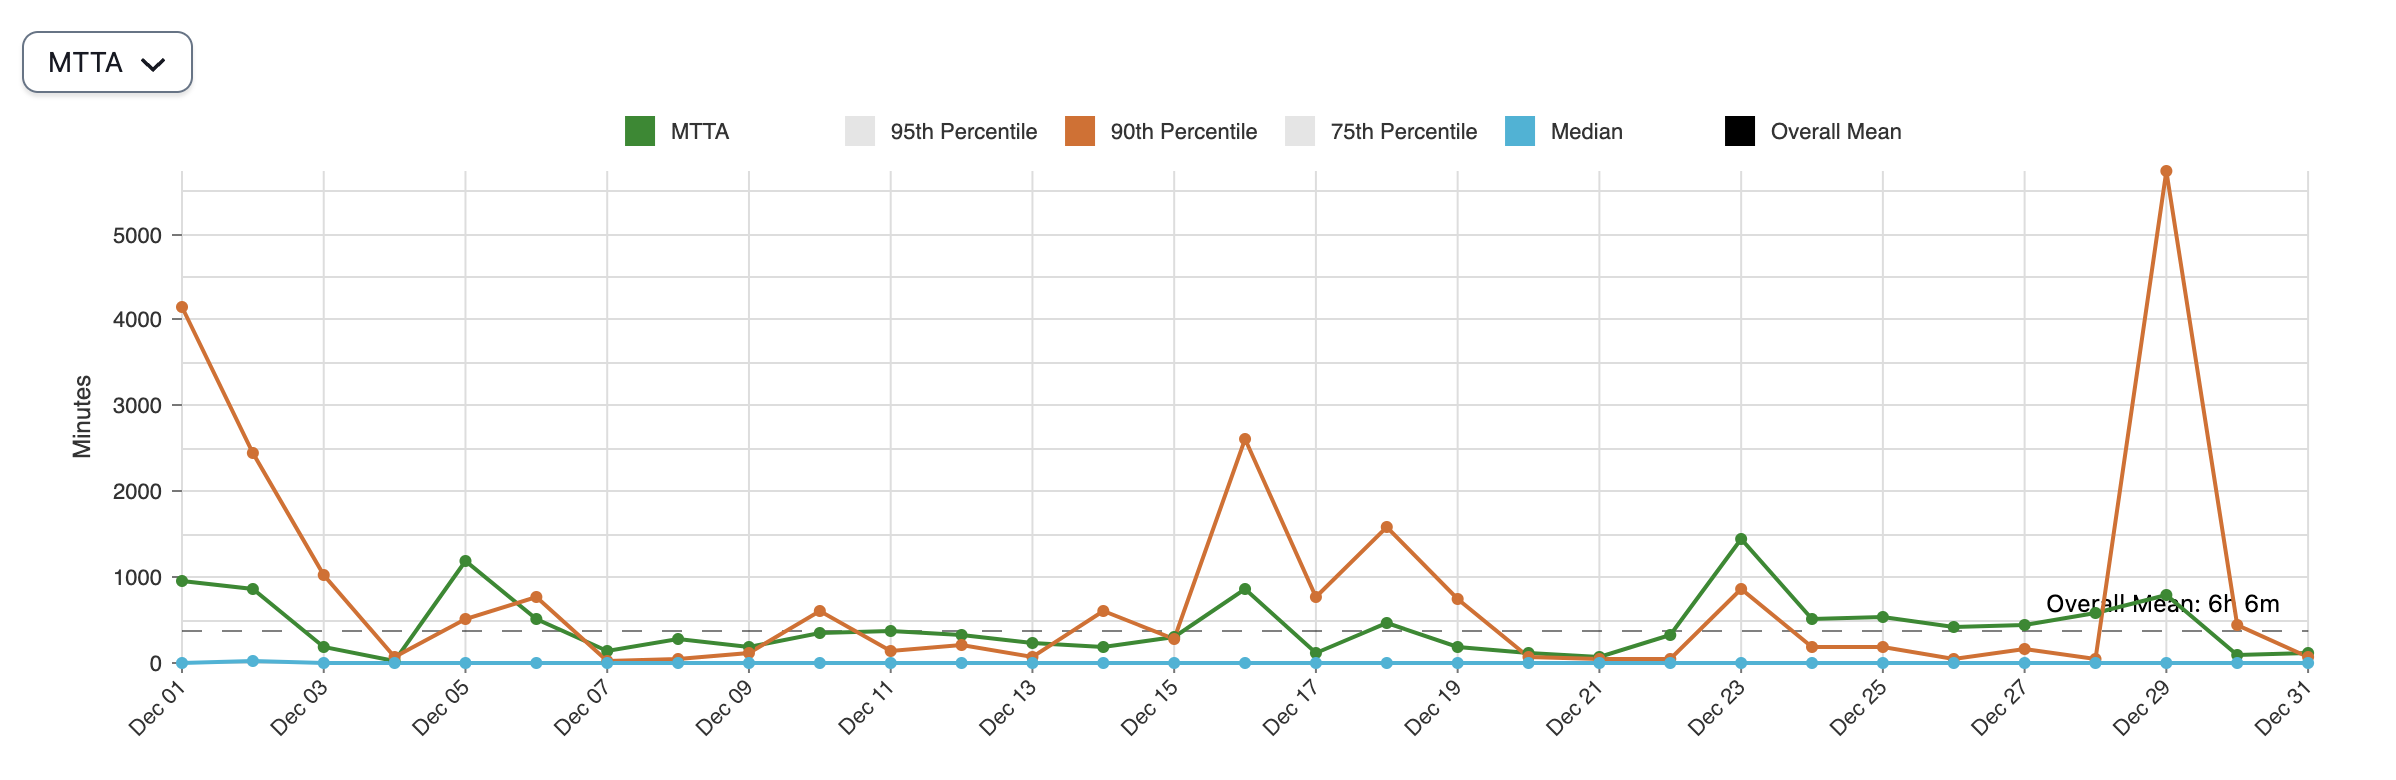
By default, the MTTA and MTTR graphs display the Overall Mean value. For a more granular look at your incident data, you can select 95th Percentile, 90th Percentile, 75th Percentile, and Median.
Data Visualizations
You can change the dropdown at the top left to select one of following visualizations:
| Visualization | Description |
|---|---|
| Incident Volume | Number of incidents. |
| Response Effort | Number of hours. The user-defined incident duration, if it exists, is used for this calculation. Read Edit Incident Duration for more information. |
| MTTA | Mean time to acknowledge in seconds. |
| MTTR | Mean time to resolve in hours. |
Incidents List
Below the data visualization you see the Incidents List data specific to the filters you have selected. You may perform the following actions with this table:
- Search: Use the search field to search for specific data.
- Sort: Click on a column header to sort results. You can also sort with multiple columns by holding down the shift key while clicking on both of the columns. The graph above does not change if you sort the data.
- Drill Down: Click to the left of an incident number to drill down into responder details such as responder status, type of assignment, request and response timestamps, and time to respond. Click an incident number or service name in the Number and Service columns to view more information about those incidents or services.
To customize the columns you would like to view, click the Columns icon and select your preferred data. The available Incidents List columns are:
| Column Name | Description |
|---|---|
| Number | Incident number. |
| Incident Type | An incident's Incident Type. |
| Title | Incident title. |
| Urgency | An incident's urgency level. |
| Priority | An incident's priority level. |
| Service | The service where the incident triggered. |
| Created at | The date and timestamp when the incident was triggered. |
| Resolved by | The responder who resolved the incident. |
| Auto Resolved | Whether or not the incident resolved automatically, either via an integration or in PagerDuty. |
| Responders | The total number of responders who engaged with the incident. |
| TTA | The amount of time between incident creation and when the first responder acknowledged the incident. |
| TTR | The time from incident creation to when it was resolved. |
| Response Effort | The total engaged time across all responders, measured from the time a responder acknowledges or accepts a responder request until the incident is resolved. Response Effort of resolved incidents can be edited on an incident's details page. Edited values are marked with an asterisk (*). |
| Escalations | The total count of escalations. |
| Incident ID | Incident ID (e.g., PXXXXXX). |
| Status | The incident's status: Triggered, Acknowledged, or Resolved. |
| Service ID | The service's ID (e.g., PXXXXXX). |
| Team | The name of the Team associated with an incident. This may differ from the team shown in the main Incidents list if the incident's service or escalation policy has been reassigned to a different team since the incident was triggered. |
| Team ID | The Team's ID (e.g., PXXXXXX). |
| Escalation Policy | The escalation policy's name. |
| Escalation Policy ID | The escalation policy's ID (e.g., PXXXXXX). |
| Assigned User IDs | The User IDs of the users assigned to the incident. |
| Assigned Users | The users who were assigned to the incident, including through reassignment or escalation. This list is not in the order of assignments. |
| Acknowledged User IDs | The User IDs of the users who acknowledged the incident. |
| Acknowledged Users | Users who acknowledged the incident. This list is not in the order of assignments. |
| Joined User IDs | The User IDs of the users who joined the incident. |
| Joined Users | Users who joined the incident, either by acknowledging it or accepting a responder request. |
| Resolved at | The date and timestamp when the incident was resolved. |
| Resolved by User ID | The User ID of the user who resolved the incident. |
| Active Responders | The total number of users who either acknowledged the incident or accepted a responder request in it. |
| TTE | The time from first responder engagement to last responder engagement. |
| TTM | The time between the start of an incident and the time the last additional responder acknowledges. For incidents with one or no engaged users, this value is null. |
| User Defined Response Effort | The total engaged time across all responders, as edited by the user in the incident details page. |
| Assignments | The number of times the incident was assigned. |
| Reassignments | The number of times the incident was reassigned to another user. |
| Acknowledgements | The total number of acknowledgements in the incident. |
| Timeout Escalations | Count of escalations as a result of no acknowledgement from the primary on-call responder. |
| Manual Escalations | Count of manual triggered escalations. |
| Notifications | The total count of incident notifications sent via push, phone call, email, and SMS. |
| Interruptions | Interruptions are when an on-call responder receives a mobile push, phone call, or SMS (text) notification. Notifications sent from various channels (push, phone, SMS) to the same destination are counted as one interruption. Notifications that arrive within 60 seconds of each other are counted as a single interruption. Email notifications are excluded from this metric. |
| Business Hour Interruptions | Interruptions that happened on weekdays between 8 a.m. and 6 p.m.* |
| Off Hour Interruptions | Interruptions that happened on weekdays between 6 p.m. and 10 p.m., or on a weekend between 8 a.m. and 10 p.m.* |
| Sleep Hour Interruptions | Interruptions that happened any day of the week between 9 p.m. and 8 a.m.* |
| Total Snoozed Seconds | Total seconds the incident was snoozed. |
| Custom Fields | You can add any of your Custom Fields as a column. |
* Times are given in the user's configured timezone. If they have not configured a time zone, the report uses the account's time zone.
By default, the Incidents List displays 10 results at a time. Use the dropdown below the table to select from 10, 20, 30, 40, or 50 results per page. If there are more results than the selected dropdown value, you can use the arrows (i.e., , , , ) to navigate through results.
Analytics Email Settings
Please see our Account Settings article for more information on how Admins can configure who receives weekly Analytics emails.